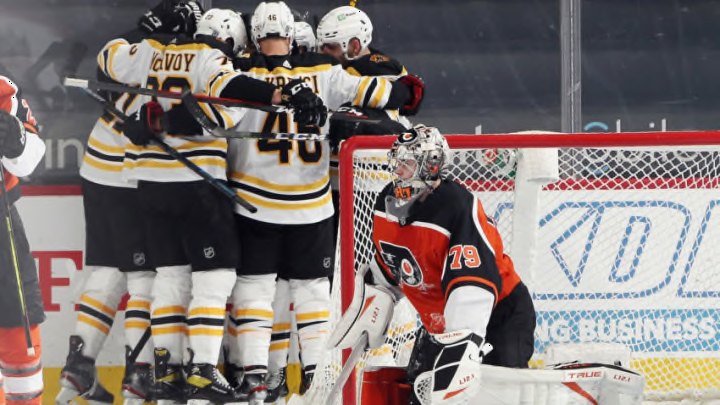
When the Philadelphia Flyers returned to play in January, the whole Delaware Valley was buzzing about the potential of this team to end their long cup drought. Things were looking good for the team throughout the month of January, as the Orange and Black got out to a 7-2-1 start and were competing for the top spot in the division.
Since then, however, the Flyers have gone 12-15-5, stumbled six points out of the last playoff spot in the East and officially waved the white flag on the season by selling off pieces at the deadline. So what exactly changed? Let’s compare some shot and save data from the two months and find out.
Hot Start, Cold Finish
We have to start by saying the Flyers got a lot better results than they deserved during January. Throughout their 10 contests during the month, the Flyers fired a total of 236 shots and scored a whopping 35 goals on them. That’s 23.6 shots per game and a 14.8 shooting percentage for those of you scoring at home.
For reference, the Washington Capitals own the NHL’s best shooting percentage for the season, and they score on only 12.2% of their shots. Meanwhile, their defense gave up an incredible 337 shots (an average of 34 per game), but got great goaltending from Carter Hart and Brian Elliott, who allowed 31 goals over the month, good for a solid 9.2 opponent shooting percentage.
The Flyers’ good fortune was bound to change eventually, and after a strange month of February, the pendulum swung completely in the other direction in March. The offense that had been very choosy, but very successful, with their chances was suddenly throwing 33 shots on net per game—a mark that would be third best in the league prorated over a full season–but scoring on only 8.2% of them–third worst in the league over a full season.
On the defensive side, the Flyers actually managed to trim down on the shots allowed, as they allowed an average of 26 shots per game (down from 33.7 in January), but their goal total sky-rocketed. They allowed a franchise record 75 goals on 439 shots in their 17 games. And their goalies were pulled five times and their opponents scored on 17.8 percent of their shots
So if the quantity of chances both for and against improved, but the team was less successful then the quality of chances must have taken a step back, right? Well, not exactly
Wait, did he just make up a stat??
I spent way more of my life than I’m proud to admit looking at all the shots and goals that came in the high-danger area I like to call “The Triangle” during all the Flyers games in January and March. To understand The Triangle, picture the trapezoid behind the goal line, and then extend the diagonal lines until they form a triangle with its point at the lower hash mark, and its base along the goal line.
When comparing the triangle shots the Flyers generated between January and March, the difference in success rate jumps right off the page. In January, Philadelphia fired 51 shots (5.1/game) from this area and scored on 21 (2.1/game) of them for a 41% success rate. During March, however, they upped their chances on both a total (91) and per-game (5.3) basis but only managed to score 15 total goals, just under 0.9 per game, and their success rate plummeted all the way down to 16%.
On the defensive side, the Flyers allowed 57 (5.7/game) triangle shots and 14 goals (1.4/game) against in January, meaning their goaltending held opponents to a 25% success rate on these chances. Despite what the team performance suggests, however, the Flyers allowed only 0.3 more of these chances per game in March (6.0) than in January and gave up 102 total. The real difference is that their opponents did a great job of taking advantage of them, scoring an average of three per game and 34 overall, getting a goal for every three of these shots taken.
